PostgreSQL EXPLAIN ANALYZE: Diagnose Slow Queries
Configure a PostgreSQL slow query log, interpret statement timings, and investigate expensive queries with EXPLAIN ANALYZE and BUFFERS.
By Hardeep · · Updated
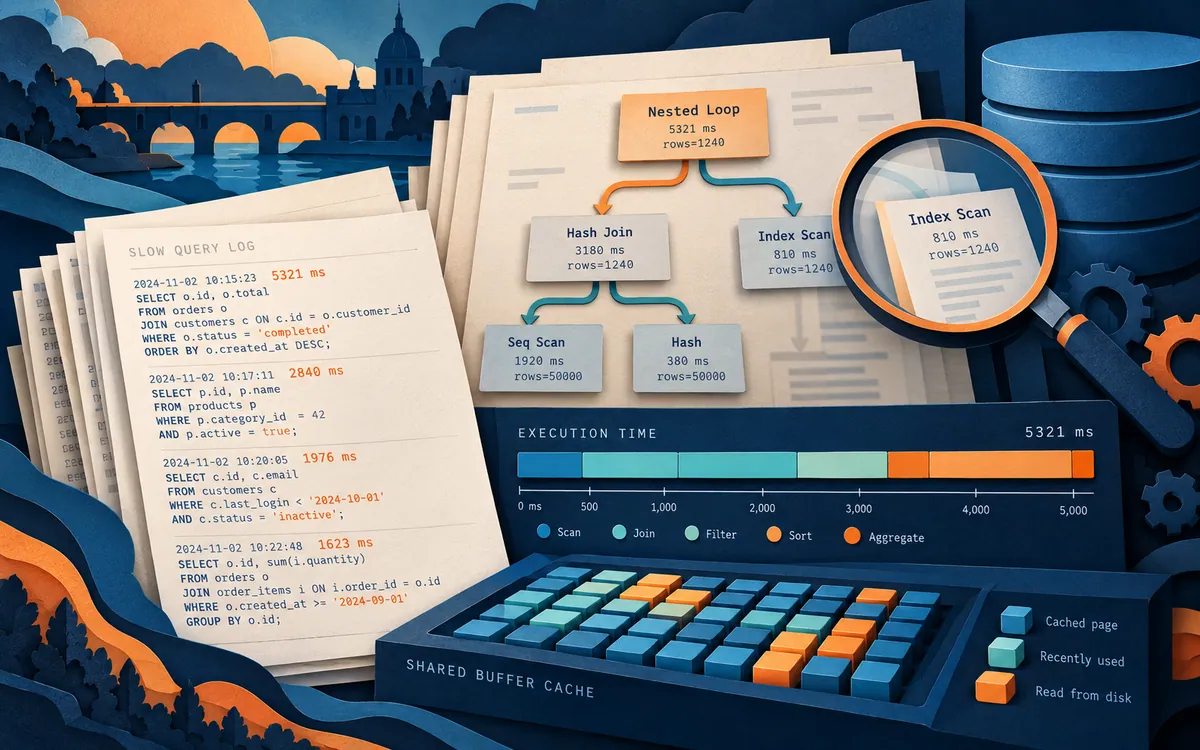
A PostgreSQL slow query log helps you identify which statements exceed a duration threshold. Capture a small, useful sample first, then inspect a representative query plan. A long duration can reflect waiting as well as execution work.
Configure and read the slow-query log
PostgreSQL's logging documentation defines log_min_duration_statement as the threshold for logging completed statements by duration. A negative value disables it; zero logs every completed statement. Begin with a threshold suited to the operation you are investigating.
-- Example for an authorized diagnostic session, not a global setting.
SHOW log_min_duration_statement;
SET log_min_duration_statement = '500ms';
-- Run representative read-only queries in this same session.
RESET log_min_duration_statement;
The SET requires a superuser or the appropriate parameter privilege. It affects this connection only. For application traffic, ask your database administrator to choose a controlled scope and time window. The log destination depends on the server configuration or hosting provider; SQL clients do not necessarily display server logs.
Find a duration entry, then record its timestamp, database, session identifier, and statement. For example, an illustrative line beginning duration: 842.317 ms means that completion exceeded a 500 ms threshold. Group repeated query shapes and check representative parameter values. A frequently executed 600 ms statement may deserve attention before a rare two-second report.
Logs can contain query text and values. Restrict access and retention, and avoid logging every production statement indefinitely. Reproduce an example safely before running the execution-plan checks below.
Start with a concrete performance target
"The database is slow" is not actionable. Choose a representative operation and define the result you need. For example: the order-history endpoint should return its first page at the 95th percentile in under 250 milliseconds while the system handles normal peak traffic.
Record at least four values before tuning: response-time percentiles, calls per minute, rows returned, and database time. An average can hide the requests that frustrate users. A query that usually takes 20 ms but occasionally waits five seconds on a lock needs a different fix from a query that consistently reads millions of rows.
Capture the real query and parameters
Plans depend on data distribution and parameter values. A query for a customer with ten orders may use a different plan from the same query for a customer with two million orders. Reproduce the slow case with realistic parameters and a production-like dataset. Avoid running an expensive write statement with EXPLAIN ANALYZE on production unless you understand its effects: ANALYZE executes the statement.
For a read-only query, begin with:
EXPLAIN (ANALYZE, BUFFERS, VERBOSE, SETTINGS)
SELECT id, created_at, total_cents
FROM orders
WHERE customer_id = 123
ORDER BY created_at DESC
LIMIT 20;
The estimated cost is a planner unit, not milliseconds. Compare estimated rows with actual rows, then inspect actual time, loops, and buffer activity. A large estimate error often points to stale statistics or correlated columns. Many shared reads can indicate an I/O-heavy plan. A node executed thousands of times may be cheap once but expensive in aggregate.
Read the plan from the inside out
Execution plans are trees. The indented nodes produce rows for their parents, so the useful question is not "Does the plan contain a sequential scan?" but "Which node consumes most of the time or reads most of the data?" A sequential scan is appropriate when a query needs a large part of a small table. An index scan is not automatically better if it causes many random heap reads.
Look for these patterns:
- Rows removed by filter: the database read many rows it did not return. A more selective index or earlier predicate may help.
- Estimated and actual rows differ greatly: run
ANALYZE, raise statistics for the relevant column, or use extended statistics for correlated columns. - Sort spills to disk: the plan reports an external sort. Reduce the input, add an order-supporting index, or test a carefully scoped
work_memincrease. - Nested loop repeats a costly inner node: the join may need an index, better estimates, or a different query shape.
- High I/O with few returned rows: check index selectivity, table bloat, visibility maps, and whether the query selects columns it never uses.
Fix query shape before server configuration
The least risky wins usually reduce work. Select the columns the caller needs instead of using SELECT *. Filter and aggregate at the database when that moves less data across the network. Remove accidental repeated queries from application loops. Use keyset pagination for deep, ordered result sets instead of asking PostgreSQL to skip a growing OFFSET.
For the order-history query, an index aligned with both the equality filter and sort order is a plausible experiment:
CREATE INDEX CONCURRENTLY idx_orders_customer_created
ON orders (customer_id, created_at DESC)
INCLUDE (id, total_cents);
The column order matters. customer_id narrows the search and created_at supplies the requested order. The included column may allow an index-only scan, but only when PostgreSQL can confirm tuple visibility without frequent heap access. Every index consumes storage and adds work to inserts, updates, vacuum, backups, and replication, so verify usage after deployment.
For a deeper treatment of index choices, see SQL indexing strategies.
Keep planner statistics representative
PostgreSQL chooses a plan from statistics, not by inspecting every row at planning time. Autovacuum normally runs ANALYZE, but bulk loads or rapidly changing distributions can leave estimates behind. Run ANALYZE after major data changes and verify that autovacuum thresholds suit large, busy tables.
A single-column histogram cannot describe every relationship. If city and postal code, or tenant and status, are strongly correlated, CREATE STATISTICS can give the planner better multicolumn information. Increase a column's statistics target only when evidence shows the default sample misses an important skew; higher targets cost planning and analysis time.
Tune memory and concurrency with scope
Settings interact with workload concurrency. work_mem applies to individual sort or hash operations, not once per connection. A complex query can use it several times, and hundreds of concurrent queries can multiply the allocation. Test changes at the session level first:
BEGIN;
SET LOCAL work_mem = '64MB';
EXPLAIN (ANALYZE, BUFFERS)
SELECT ...;
ROLLBACK;shared_buffers, the operating-system cache, connection counts, checkpoint behavior, and storage latency also matter, but they should follow workload evidence. A connection pool protects the database from excessive backend processes; it does not make an overloaded database infinitely scalable. Set pool sizes from measured throughput and wait behavior, not from the number of application threads.
Check locks, vacuum, and bloat
A fast plan can still wait. Inspect pg_stat_activity and pg_locks when latency spikes. Long transactions keep old row versions visible, delay vacuum cleanup, and can increase table and index size. "Idle in transaction" sessions deserve special attention because the application may have forgotten to commit or roll back.
Dead tuples are normal in PostgreSQL's multiversion concurrency model. The problem is cleanup that cannot keep pace. Track autovacuum activity, dead-tuple estimates, transaction age, and relation growth. Do not schedule routine VACUUM FULL as a generic fix; it takes a strong lock and rewrites the table. Correct the workload or autovacuum problem first.
Validate one change at a time
- Save the original plan and latency distribution.
- State the hypothesis, such as "the sort spills because the filter returns 400,000 rows."
- Make one reversible change in a staging or scoped environment.
- Run the same parameters several times and distinguish warm-cache from cold-cache behavior.
- Check write latency, storage, replication lag, and other queries for regressions.
- Deploy with monitoring and a rollback instruction.
The best change is not always the plan with the lowest single-run time. Production tuning must preserve predictable tail latency and enough capacity for concurrent work.
A diagnostic table for the next incident
Use this table to choose the next measurement. These are diagnostic hypotheses, not benchmark results or guarantees. Several causes can appear together, so preserve the original plan and compare changes under the same workload.
| Symptom | Evidence to inspect | First experiment | Regression to watch |
|---|---|---|---|
| Slow first page of ordered results | Large sort input and many filtered rows | Test an index matching the filter and order | Insert latency and index size |
| Occasional long stalls | Wait events and blocking transaction age | Shorten the blocking transaction in staging | Application transaction correctness |
| Disk-based sort | External sort method and temporary I/O | Reduce input rows before testing session memory | Total memory under concurrent load |
| Unexpected join plan | Estimated versus actual row counts | Refresh statistics and inspect column correlation | Plans for other parameter values |
| Table grows despite deletes | Dead tuples, vacuum history and old transactions | Find transactions preventing cleanup | Vacuum I/O and replication lag |
Keep a short incident record with the query fingerprint, parameter class, plan, relevant server version, and before-and-after measurements. Do not place customer identifiers or secret values in shared performance notes. A colleague should be able to reproduce the experiment and understand why the change was retained.
Frequently asked questions
Should every sequential scan be removed?
No. Sequential scans are efficient when a query needs a large share of a table or the table is small. Investigate whether the scan reads far more rows than the query returns and whether that work dominates total time.
Does a lower EXPLAIN cost mean the query will be faster?
Cost is the planner's estimate for comparing candidate plans. Use EXPLAIN ANALYZE and workload measurements to evaluate actual performance, then investigate large estimate errors.
What should I tune first?
Start with the highest-impact query or wait event you can reproduce. Fix unnecessary work and missing access paths before changing global configuration.
Primary sources
- PostgreSQL: Using EXPLAIN
- PostgreSQL: Indexes
- PostgreSQL: Statistics Used by the Planner
- PostgreSQL: Routine Vacuuming
Separate query execution from a lock wait
If the same parameters are quick in an isolated session but slow during normal traffic, inspect wait events while the slowdown is happening. Save the blocking transaction and its age alongside the execution plan. Adding an index cannot release a lock held by another transaction.
Related reading
Send a correction with this article’s link and a supporting source.